Please download the free Adobe Acrobat Reader to view these documents.
![]() Note: Files are in Adobe (PDF) format.
Note: Files are in Adobe (PDF) format.
Please download the free Adobe Acrobat Reader to view these documents.


CONSOLIDATED INCOME STATEMENT
January-March 2011 ("1Q11")
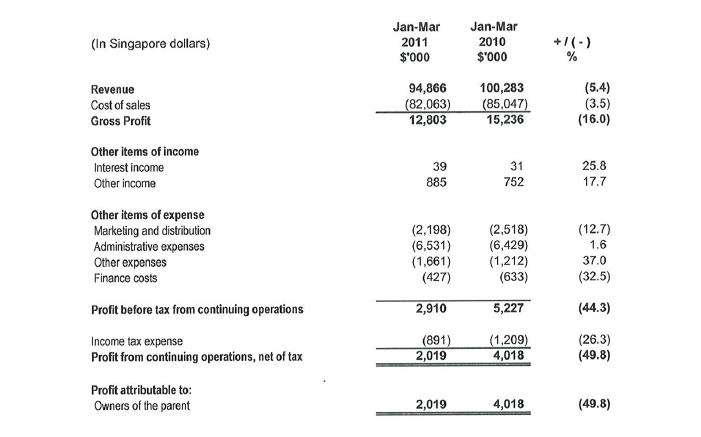
The Group's revenue decreased 5.4% from $100.3 million in 1Q10 to $94.9 million in 1Q11. Revenue from the Consumer/IT and Mould Fabrication business segments had declined by 11.8% and 7.9% respectively. This decrease was partially offset by revenue growth of 48.2% in the Healthcare business segment. Revenue from the Automotive business segment was flat, growing marginally by 0.2%.
Traditionally, the 1Q is a weak quarter. The higher revenue in the prior period (1Q10) was unusual due to inventory restocking needs in the post crisis economic recovery.

During the period, gross profit decreased by 16.0% from $15.2 million in 1Q10 to $12.8 million in 1Q11. Gross margin for 1Q11 was lower at 13.5% compared to 15.2% in 1Q10 as a result of lower utilizalion because of lower orders during the quarter.
Other expenses increased in 1Q11 compared to 1Q10 mainly due to foreign exchange losses. The Group incurred a foreign exchange loss of $1.3 mil in 1Q11 compared to $0.6mil in 1Q10.
Interest expense decreased in 1Q11 compared to 1Q10, due to lower interest rates as well as repayment of loans during the quarter.
The Group recorded a net profit of $2.0 million for 1Q11 compared to $4.0 million in 1Q10 due to lower revenue and higher foreign exchange loss. Excluding foreign exchange effects, the net profit would have been $3.4 million in 1Q11 compared to $4.6 million in 1Q10.
CONSOLIDATED BALANCE SHEET
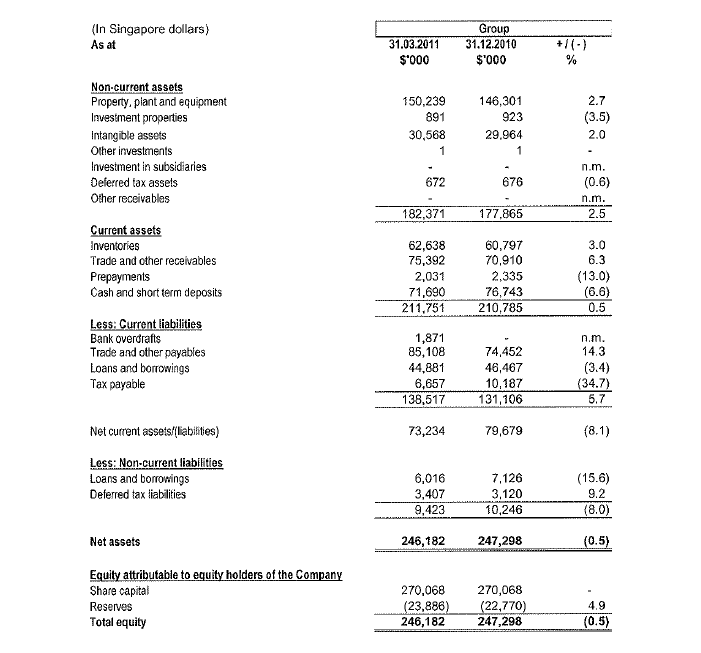
The Group's property, plant and equipment was at $150.2 million as at 31 March 2011 compared to $146.3 million as at 31 December 2010. The increase was due to the acquisition of UFE, construction of a factory in Johor Bahru, Malaysia and purchase of machines & equipment in certain manufacturing plants, net of a depreciation charge of $5.9 million (1Q10: $6.5 million) incurred during the period.
Inventory increased by 3.0% from $60.8 million as at 31 December 2010 to $62.6 million as at 31 March 2011, Trade and other receivables increased by 6.3% from $70.9 million as at 31 December 2010 to $75.4million as at 31 March 2011 and Trade and other payables increased by 14.3% from $74.5 million as at 31 December 2010 to $85.1 million as at 31 March 2011. These are largely due to the Acquisition, while the increase in payables is due to the acquisition of plant, property and equipment.
The increased in bank overdrafts was due to the Acquisition.
Loans and borrowings decreased to $50.9 million as at 31 March 2011 from $53.6 million as at 31 December 2010 due to repayment of some loans.
The Group maintained a cash balance of $71.7 million as at 31 March 2011 (31 December 2010: $76.7 million) resulting in net cash of $18.9 million (31 December 10: $23.2 million).
CONSOLIDATED CASHFLOW STATEMENT
January-March 2011 ("1Q11")
Net cash generated from operating activities was $7.4 million for 1Q11, compared to $3.7 million for 1Q10. Net cash used in investing activities was $8.1 million for 1Q11 compared to $1.0 million in 1Q10 due to payment for the purchase of machines & equipment and the Acquisition. Net cash used in financing activities for 1Q11 was $4.6 million compared to $3.6 million in 1Q10 due to more repayment of loans.
As we expected, 1Q11 revenue was lower than 1Q10 when many customers replenished their inventories after the 2009 downturn.
We began the year with an optimistic but cautious view. However, the rate of US Dollar weakening against our costs, denominated primarily in Singapore Dollar, Malaysian Ringgit and Chinese Renminbi in recent months was much faster than we had anticipated. WTI crude oil rose from around US$80 a barrel last year to above US$110 recently, which is at its highest level since 2008. This is unfavourable for our raw materials and logistics costs. The above two external factors have added tremendous pressure on margins.
At this point in time, the Japan tsunami has had an insignificant impact on our orders but we expect it wi!! eventually when the inventories pipeline on the ocean are consumed. It is difficult to quantify at this time but we believe it is manageable.
The Automotive business orders remain strong. Several new projects across the regions are also in the pipeline. We expect to improve our efficiency when we complete the move from Bintan to the new automotive plant in Johor by early 3Q.
The Consumer/IT business remains steady. Orders from our existing customers remain strong. Through our business development effort, we managed to secure new projects from existing and new customers that will go into mass production in 2H this year.
The Healthcare business outlook remains good. We continue to be on track growing our existing customers and developing new customers to expand our customer base. We expect it to be the fastest growing segment for this year.
The Mould Fabrication business remains strong. We completed the acquisition of UFE Pte Ltd and that has expanded our customer base geographically.
The group recently added a new factory in Johor as part of South East Asia's manufacturing expansion because we have outgrown our existing footprint. We expect it to be fully operational by 3Q this year.
Although we expect the business environment to remain very volatile and challenging for the remainder of the year, the management team will remain very focused in managing the dynamic business environment.